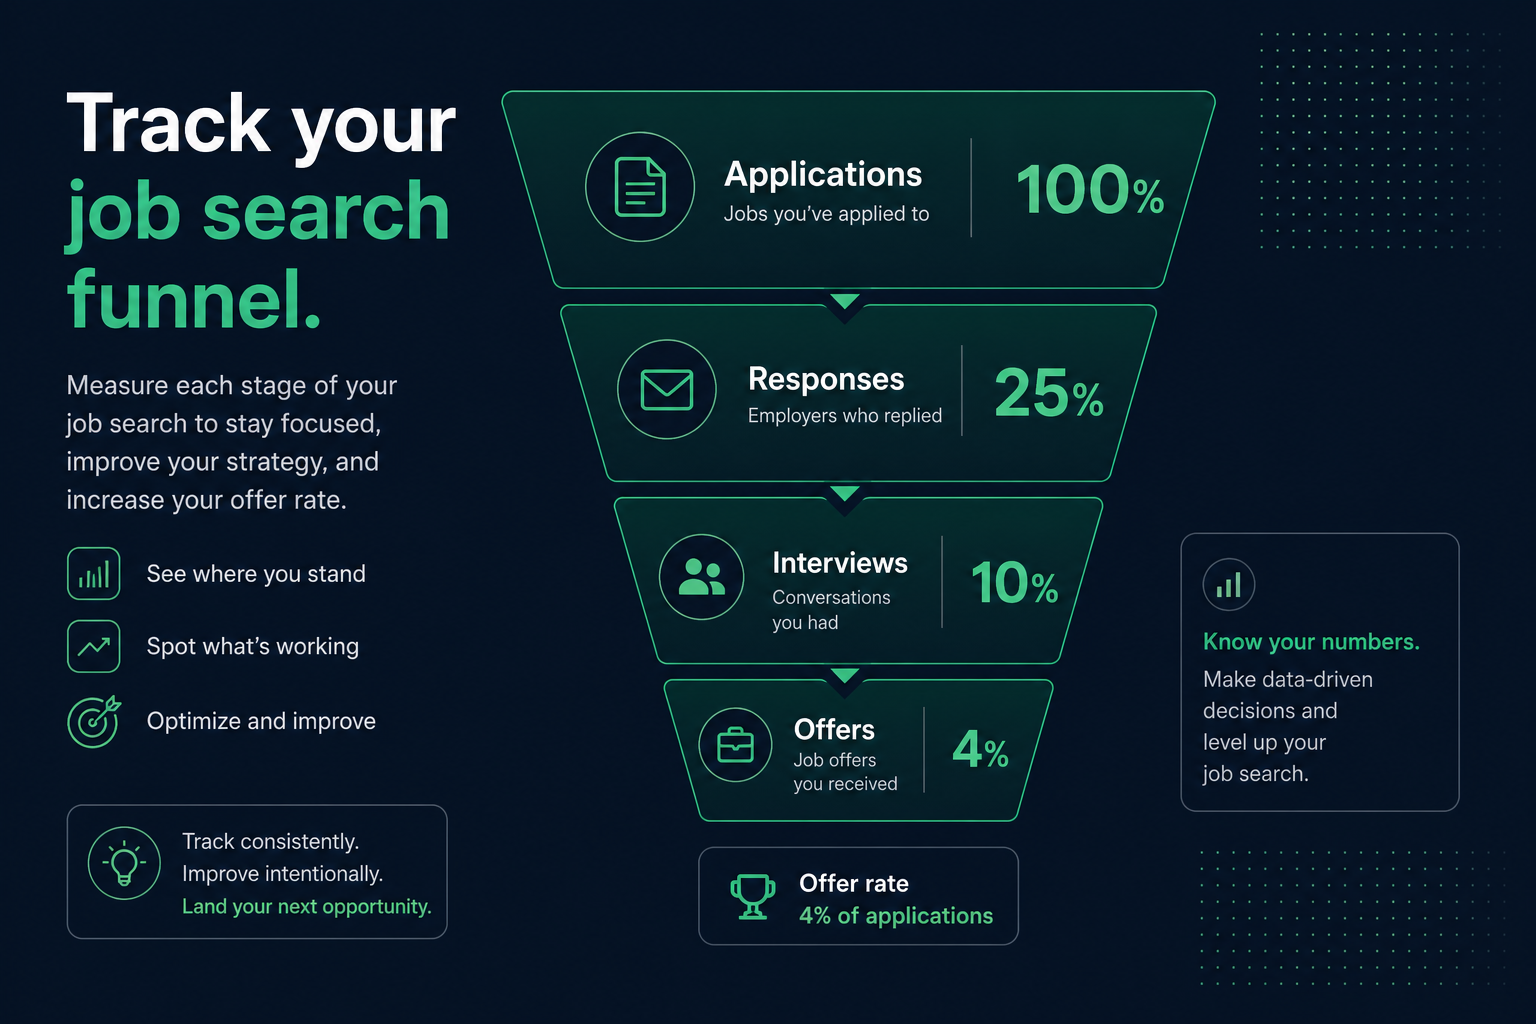
A job search is a funnel with four stages: applications sent, responses received, interviews scheduled, and offers made. Most people can tell you the first number and almost nothing else. That is a problem, because the first number tells you the least—if you have sent 150 applications and gotten zero responses, the fix is completely different from sending 150 applications and getting 20 responses but zero interviews.
AI-powered job search platforms increasingly surface these conversion numbers automatically in 2026, which has made "know your funnel" a realistic habit instead of a spreadsheet chore. This guide covers what to track, roughly what a healthy conversion rate looks like at each stage, and how to diagnose exactly where yours is leaking.
Key Takeaways
- Track four stages separately — application-to-response, response-to-interview, interview-to-final, and final-to-offer — since each is controlled by different factors.
- Zero interviews after many applications points to a resume or targeting problem; interviews with zero offers points to interview performance instead.
- Exclude confirmed ghost-job applications from your denominator or your response rate will look artificially low.
- A rolling four-week window separates real trends from normal week-to-week noise.
- Benchmarks shift significantly by seniority level, so compare yourself to your own career stage, not a single overall number.
- The four stages of a job search funnel, and what each one actually tells you
- Rough 2026 benchmarks for each conversion rate
- A simple tracker you can set up in ten minutes
- How to diagnose a leak at each specific stage
- When to change strategy vs. when to just keep going
The four stages, and what each one actually measures
Key Takeaway
Each funnel stage is driven by a different set of factors, so a single overall "applications sent" number collapses four separate problems into one useless figure.
| Stage | What it measures | Mostly controlled by |
|---|---|---|
| Application → response | Whether your resume clears initial ATS/AI screening and targeting | Resume content, tailoring, format |
| Response → interview | Whether a recruiter screen or first-round conversation goes well | Communication, availability, fit signaling |
| Interview → final round | Whether your interview performance and story land | Interview prep, examples, questions asked |
| Final round → offer | Whether you beat the other finalists and pass reference/background checks | Competing candidates, negotiation, references |
Notice that each stage is controlled by a mostly different set of factors. That is exactly why a single overall number ("I've applied to 200 jobs") is nearly useless for diagnosis—it collapses four separate problems into one that could mean anything.
Rough 2026 benchmarks (directional, not a guarantee)
Key Takeaway
Treat these ranges as sanity checks, not targets — if you fall a full order of magnitude below them over a meaningful sample, that stage needs attention first.
These vary enormously by industry, seniority, and market conditions, but as a rough sanity check across a typical white-collar search in 2026:
- Application → response: Often in the low single digits as a percentage for cold applications; meaningfully higher (sometimes 15-30%) through a referral or direct outreach.
- Response → interview: A large majority of responses that are not an outright rejection typically progress to at least a first screen.
- Interview → final round: Often somewhere in the 25-50% range depending on how many rounds the process has and how competitive the pool is.
- Final round → offer: Frequently one in two to one in four, since most processes carry two or more finalists into the last stage.
Treat these as sanity-check ranges, not targets. If your application-to- response rate is a full order of magnitude below these—say, under 0.5% over a meaningful sample of 40+ applications—that stage is where your search needs attention first, regardless of what is happening later in the funnel.
A simple tracker you can set up in ten minutes
Key Takeaway
A basic spreadsheet with six columns is enough — the weekly ritual of updating and reviewing it matters more than the sophistication of the tool.
You do not need specialized software—a spreadsheet with these columns is enough to see your real conversion rates within a few weeks:
Minimum viable columns
- Company, role, and date applied
- Application source (referral, cold apply, recruiter outreach)
- Ghost-job check result (see our guide on spotting fake postings)
- Response received? (Y/N and date)
- Interview stage reached (screen, first round, final, offer)
- Outcome and, if rejected, any feedback given
At the end of each week, calculate two numbers: responses ÷ applications, and interviews ÷ responses. Watching these two ratios over a rolling four-week window—rather than any single week's noise—is what actually tells you whether a change you made (a new resume version, a new targeting strategy) is working.
How to diagnose a leak at each stage
Key Takeaway
Match the fix to the stage that is actually leaking — a resume rewrite will not fix an interview-performance problem, and interview coaching will not fix a parsing issue.
Common ATS platforms behave differently at this first stage, which is worth knowing before you assume a low response rate is purely a content problem. Workday's parser can misread multi-column layouts and split a single job into fragments, while Greenhouse's keyword-matching logic weights exact phrase matches from the job description heavily — a resume that says "customer support" instead of the posting's "client success" can score lower even when the experience is identical.
Low application → response
- Check the resume itself for ATS parsing issues and generic phrasing
- Confirm you are not accidentally counting ghost-job applications in the denominator
- Check your Job Match Score against a sample of the listings
- Shift more volume toward referrals if cold-apply rate is near zero
Low response → interview
- Review how quickly you reply to recruiter outreach—slow replies lose slots
- Check whether your stated salary range is filtering you out at the screen
- Ask a mentor to mock-screen you for basic fit signaling issues
Low interview → final round
- Prepare specific, quantified STAR stories rather than general answers
- Ask for feedback directly when rejected after this stage—many recruiters will give it
- Record a mock interview and review your own pacing and clarity
Low final round → offer
- This stage is heavily about the other finalists—do not over-index on any single loss
- Review reference readiness before you reach this stage next time
- Ask what tipped the decision if the company is willing to share
Before you diagnose a leak, rule out the simplest explanation — confirm your resume actually parses cleanly.
Run a free ATS check on HireFlowWhen to change strategy vs. when to keep going
Key Takeaway
Wait for 25-40 applications or three-plus interviews stalling at the same stage before changing strategy — small samples produce misleading noise.
Small sample sizes lie. Five applications with zero responses tells you almost nothing—that is well within normal variance. The threshold worth acting on is roughly 25-40 applications at a consistent conversion rate well below the benchmarks above, or three or more interviews in a row that stall at the same specific stage. Both patterns are large enough samples to trust, and specific enough to point at one fixable stage rather than a vague sense that "the market is bad."
Benchmark conversion rates by seniority level
Key Takeaway
Conversion rates generally improve with seniority while application volume drops — compare your numbers to your own career stage, not an aggregate benchmark.
The overall benchmarks covered earlier are useful starting points, but they flatten a meaningful pattern: the funnel shape changes quite significantly depending on where you are in your career. Entry-level candidates typically send many more applications and see lower per-application rates, while senior and executive candidates send far fewer but better-targeted applications and tend to see higher per-application rates at each stage—even though the total number of available roles is smaller.
| Seniority | Typical application-to-interview range | Typical interview-to-offer range | Key dynamic |
|---|---|---|---|
| Entry-level (0 to 2 years) | 2–6 percent for cold applications | 15–25 percent | High competition and generic resume formats; referrals move the needle most at this level |
| Mid-level (3 to 7 years) | 5–12 percent for cold applications | 20–35 percent | Strong specialization and quantified achievements increasingly differentiate candidates from the pool |
| Senior or manager (8 to 15 years) | 10–20 percent for well-targeted applications | 25–45 percent | Fewer applications needed; recruiters also initiate contact more frequently at this level |
| Executive (VP and above) | 15–30 percent for targeted outreach | 30–55 percent | Most hiring happens through direct network or search firms; cold applications to posted roles are rare and less effective |
There are two important things to notice in this table. First, the conversion percentages at every stage improve as seniority rises—but total application volume also drops sharply, so the absolute number of interviews does not necessarily change much. Sending fewer, better-targeted applications is not laziness; at mid-level and above it is often the more efficient strategy.
Second, at the executive level the application-to-interview rate becomes somewhat less meaningful as a primary diagnostic metric, because most movement happens through network referrals and executive search—not cold submissions to posted roles. If you are at that level and still relying heavily on cold applications, the channel mix itself may be the real gap rather than any single conversion percentage.
For mid-level candidates especially, these benchmarks reveal a common trap: sending 80 generic applications and achieving a 3 percent response rate, when a more targeted set of 20 tailored applications might yield a 12 percent response rate. Volume without targeting often looks productive and produces very little. Your rolling conversion rate is the only number that shows you which pattern you are actually in.
A worked numeric example: diagnosing a broken funnel
Key Takeaway
Two job seekers with identical application totals can have completely different problems — stage-by-stage data is what separates a resume issue from an interview issue.
Abstract benchmarks are easier to internalize when you see them applied to a concrete situation. Here are two hypothetical job seekers who have both sent 80 applications. Their raw numbers look almost identical from the outside, but their stage-by-stage data tells completely different stories—and points to completely different fixes.
Scenario A: 80 applications, 4 interviews, 0 offers
Application-to-interview rate: 4 divided by 80 equals 5 percent. Interview-to-offer rate: 0 divided by 4 equals 0 percent.
The 5 percent application-to-interview rate is low but not dramatically broken for cold mid-level applications—it sits near the floor of the normal range, which means the resume is doing some filtering work even if it could be stronger. The real signal is the 0 percent interview-to-offer rate across four separate conversations at different companies. That pattern almost never points to the resume. Four interviewers at four different organizations all said no—the problem is almost certainly interview performance, how clearly the candidate articulates their story, or a persistent mismatch between the roles being targeted and the experience being brought to the table.
The correct fix here is not a new resume version. It is mock interviews, sharper STAR stories, and possibly a recalibration of which roles are a genuine fit versus which ones merely look good on paper.
Scenario B: 80 applications, 0 interviews, 0 offers
Application-to-interview rate: 0 divided by 80 equals 0 percent. There is no interview-to-offer rate to calculate yet because the funnel has not produced any interviews.
This is a clear top-of-funnel problem. Eighty applications with zero responses means the resume is either failing ATS screening before any human sees it, the roles being targeted are a poor fit for the stated experience level, a significant portion of the application list consists of ghost jobs that were never going to be filled, or some combination of all three. Interview preparation is completely irrelevant to fix right now—no amount of prep changes what happens before the first conversation.
The fix lives earlier in the chain: run the resume through an ATS checker, calculate a Job Match Score against specific listings being applied to, and audit the application list for potential ghost jobs before drawing any further conclusions.
What makes conversion rate tracking valuable is exactly this ability to separate the two scenarios. Without stage-by-stage data, both job seekers above would describe their situation identically: "I have sent 80 applications and gotten nowhere." With the data, one has an interview performance problem and the other has a resume and targeting problem—and those require entirely different interventions that would make things worse, not better, if swapped.
A third pattern worth naming: 80 applications, 20 responses, 8 interviews, and 0 offers. Here the application-to-response rate (25 percent) and response-to-interview rate (40 percent of responses) are both healthy. The issue is concentrated entirely at the final stage. This is often the hardest pattern to address because it involves competing directly with other strong finalists, reference quality, and small presentation differences that are difficult to see from the inside. This is precisely when requesting post-rejection feedback becomes most worthwhile—many recruiters will share it if asked promptly and professionally.
Setting up a simple tracker that takes under 5 minutes a week
Key Takeaway
Log each application the day you send it and review the tracker weekly — a lightweight system you actually maintain beats an elaborate one you abandon.
One of the most common reasons job seekers do not track their conversion rate is that every productivity article they encounter recommends a 20-column spreadsheet that takes 15 minutes per application to maintain. That level of overhead is counterproductive and gets abandoned quickly. The goal is a system light enough that you actually use it, and precise enough that it answers the two questions that matter: what is my application-to-response rate, and what is my response-to-interview rate.
Columns that actually earn their place
- Date applied — lets you calculate time-to-response and identify patterns by week or month
- Company and role title — the minimum identifier needed to locate the application again later
- Source — cold apply, referral, or recruiter outreach; this is the single most predictive split in most trackers
- Tailored? (yes or no) — one character per row that, over time, tells you whether tailoring is actually moving your numbers
- Response received? (yes or no, and date) — the key numerator for your application-to-response rate
- Highest stage reached — none, phone screen, first round, final, or offer; this determines your interview-to-offer rate
Columns that are usually overkill early on
- Salary range listed (useful for negotiation conversations later, but not for funnel diagnosis)
- Recruiter name and contact details (a separate contacts list handles this better)
- Notes on every single touchpoint (good for individual follow-up, not for spotting aggregate patterns)
- Color-coded priority tiers (worth adding once the system is established and running, not before)
The weekly review ritual matters as much as the columns you track. Set aside ten minutes at the same time each week—Sunday evening or Monday morning tends to work well for most people—and do exactly three things in that window:
- Log any applications sent since the last review (two to three minutes if you have been saving job titles as you apply)
- Update the response and stage columns for anything that moved forward or received a rejection
- Calculate your rolling four-week application-to-response rate and compare it to the prior four-week period
That four-week rolling window is what separates signal from noise. A single week with zero responses could be bad timing, a hiring freeze at a handful of companies, or the natural variance in how quickly applications are processed. Four consecutive weeks of near-zero response on a consistent volume of applications is a real pattern worth acting on. The rolling window also means you will notice improvement after making a deliberate change—a new resume version, a shift toward referrals, a different targeting strategy—within a few weeks rather than guessing whether it helped.
One habit worth building in from the start: log each application the day you send it rather than in a weekly batch. The act of logging immediately keeps your denominator accurate and eliminates the "I think I applied there but I am not sure" problem that quietly corrupts the numbers over time. Everything else in the tracker can wait for the weekly review; the date and company entry cannot.
Where to take this next
If your leak is at the top of the funnel, start with HireFlow's Job Match Score against three or four real listings to see whether tailoring or formatting is the bottleneck, and make sure you are not counting fake listings in your denominator—our guide on spotting ghost jobs covers exactly how to filter those out before they skew your numbers.
Frequently asked questions
The rough threshold worth acting on is around 25 to 40 applications at a consistent rate that sits well below the benchmarks for your seniority level. Below 20 applications, variance is too high to distinguish a real pattern from a bad week of timing. If you hit 30 applications with zero responses and a clear targeting strategy, that is enough signal to make one deliberate change—not a complete overhaul—and then wait another 20 applications to see whether the needle moved.
No—or at least flag and isolate them. Ghost jobs are postings that are already filled, frozen indefinitely, or never intended to be acted on in the near term. Counting them in your denominator inflates your total application count and artificially deflates your response rate, making your resume look worse than it actually is. If you suspect a posting is a ghost job before applying, skip it. If you apply and later confirm it was a ghost posting, mark it separately and calculate your rate both with and without those entries to get an accurate picture of where you actually stand.
Across most professional roles, converting roughly one in three to one in five first-round interviews into an offer is a reasonable outcome. If you are converting fewer than one in seven over a meaningful sample of eight or more interviews, that is worth investigating—usually through mock interviews, better-prepared STAR examples, or honest feedback from a recruiter or mentor who has observed you in a practice setting. Keep in mind that some of this variance is outside your control: pool quality, internal candidates, and hiring freezes that occur mid-process all affect final outcomes in ways your performance alone cannot override.
Most job seekers who track this in their own data find that tailored applications convert at roughly two to three times the rate of generic ones for cold submissions. The effect is meaningfully smaller when applying through a referral, where the recommender's credibility is doing a large share of the filtering work regardless of resume wording. Tailoring every single application is usually not necessary; targeting the right roles and tailoring the ones where the fit is genuinely strong tends to produce better results than light tailoring spread across a high volume of borderline fits.
Yes, and it is worth keeping two separate counts. An explicit rejection is a confirmed data point: the company saw your application, made a decision, and communicated it. Silence after three to four weeks is a probable no, but it could also mean the role was paused, the recruiter is running behind, or the posting was a ghost job. A clean approach is to count anything older than four weeks with no response as a working no for rate calculation purposes, but keep it in a clearly labeled separate column so you can revisit if a recruiter resurfaces unexpectedly.
A reliable trigger is two consecutive four-week windows where your application-to-response rate stays meaningfully below the benchmark for your seniority level, even after ruling out ghost jobs and sourcing mix as confounding factors. At that point, a targeted resume revision—focused specifically on the roles and seniority tier you are applying to—is likely to move the number. Revising more frequently than once every six to eight weeks usually introduces noise rather than improvement, because you will not have accumulated enough new data to know whether any individual change actually worked.